top of page
Cable-Stayed Bridge

BIM Dashboards & Power BI

Project Data You Can Read at a Glance

Building Wireframe Design
Engineer Reviewing Blueprint

We turn model, schedule, cost and progress data into dashboards that show project teams and leadership where things stand.


Dashboards we build:

  • Progress: planned vs actual by zone and activity

  • Coordination: open and closed issues by trade

  • Cost and quantities: budget, committed and changes

Why MANSYCOM

Since 2006, MANSYCOM has delivered BIM on airports, metro systems, campuses and towers up to 2M sq ft, for clients including L&T, Tata Projects and Kalpataru.


Our process follows ISO 19650, PAS 1192, COBie and IFC, so dashboards and power bi fits into the wider project from day one, not as a separate deliverable.
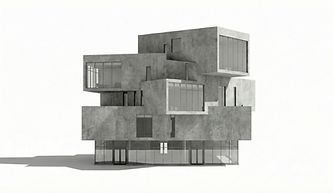
Modern Concrete Building

What You Get

Futuristic Concrete Building

Every engagement comes with clear, usable deliverables:

  • Dashboard design and build

  • Data connections to models, schedules and cost data

  • Automated refresh

  • Role-based views for teams and leadership

  • Documentation and handover

  • Training for your team

How We Work

A clear five-step workflow:

  • 1. Define: questions the dashboard must answer

  • 2. Connect: data sources

  • 3. Design: views and measures

  • 4. Validate: data with your team

  • 5. Deploy: share and train

Cleaning Building Windows

Tools & Standards

Team Planning Session

We work to open standards and your BIM Execution Plan:

  • Software: Power BI or your reporting platform

  • Sources: BIM models, Primavera P6, MS Project and cost data

  • Outputs: dashboards, reports and data models

  • Refresh: scheduled updates from source data

Where We Use It

Where this service makes the biggest difference:

  • Project leadership and PMO

  • Owners tracking programmes

  • Contractors tracking progress

  • Coordination teams tracking issues

Virtual Reality Experience

Ways to Work With Us

Team Training Session

Start small and scale up. Choose the engagement that fits your project and your team:

  • Pilot dashboard: one dashboard on your data

  • Project reporting: a set of dashboards for a project

  • Enterprise reporting: dashboards across a portfolio

Frequently Asked Questions

Answers to the questions project teams ask us most often:

  • Do you use Power BI? Yes, or your preferred reporting tool.

  • Can you connect to our schedule? Yes, Primavera P6 and MS Project.

  • Can dashboards refresh automatically? Yes.

  • Who maintains them? We hand over with documentation, or support ongoing.

Job interview
bottom of page